
We Analyzed 48,567 Art Call Submissions to Find the Best Time to Apply
Most artists pick art calls based on deadline, medium, and entry fee. Few think about timing as a factor on its own.
That is worth correcting. We analyzed 48,567 judged entries across 2,604 calls on EntryThingy between 2021 and 2026 to find out which months actually give artists the best odds. July came out on top, with an acceptance rate nearly 25 points higher than the weakest month, April.
Here is what the data actually shows.
How We Collected This Data
We pulled anonymized jurying data from EntryThingy's platform covering January 2021 through May 2026.
The dataset includes 48,567 judged entries across 2,604 calls. Acceptance rates are calculated from entries with a final accepted or rejected decision. Pending entries are excluded.
This follows the same methodology as our art call acceptance rates study and our entry fee analysis, using actual juror decisions rather than self-reported figures.
July, January, and February Are the Best Months to Apply to Art Calls
July has the highest acceptance rate in the dataset at 77.82%. January follows at 77.16% and August at 76.38%. February sits at 69.90% but has a separate advantage covered in the next section.
| Month | Acceptance Rate |
|---|---|
| January | 77.16% |
| February | 69.90% |
| March | 65.69% |
| April | 53.22% |
| May | 59.95% |
| June | 54.45% |
| July | 77.82% |
| August | 76.38% |
| September | 67.79% |
| October | 60.02% |
| November | 53.68% |
| December | 55.68% |
What drives these peaks? Summer months see lower overall submission volumes as fewer artists are actively applying. January gets a boost from a fresh wave of new calls posted at the start of the year, which brings more opportunities relative to the number of artists submitting. Both effects reduce competition and push acceptance rates up.
For an artist submitting 20 applications a year, shifting their calendar toward July, January and away from the weakest months could mean roughly 5 additional acceptances annually, based on the rate differences in the dataset.
April and November Have the Lowest Acceptance Rates on the Platform
April sits at 53.22% and November at 53.68%. June is close behind at 54.45%. These three months form a consistent low band in the data, a full 24 points below July's peak.
Spring months (March through June) attract the highest submission volumes as artists prepare work for summer exhibitions. More artists applying to the same number of available spots drives acceptance rates down. November follows a similar pattern, with artists rushing to build exhibition credits before the end of the year.
This does not mean you should never apply in April or November. It means you need to be more selective. A strong call that is a genuine fit for your work is still worth applying to in any month. A borderline application in April is a much weaker bet than the same application in July.
August Attracts the Most Competition. February Attracts the Fewest.
The acceptance rate tells you how many artists got in. Competition tells you how many you were up against.
In our study, we measured competition by looking at the average number of entries per call, grouped by the month the call deadline fell in. A higher number means more artists submitted to each call that month.
| Month | Avg Entries Per Call |
|---|---|
| January | 11.5 |
| February | 7.9 |
| March | 12.5 |
| April | 9.0 |
| May | 10.1 |
| June | 11.7 |
| July | 10.4 |
| August | 17.1 |
| September | 13.0 |
| October | 8.3 |
| November | 11.9 |
| December | 10.0 |
Most competitive: August (17.1 average entries per call). Least competitive: February (7.9 average entries per call). Second least competitive: October (8.3).
August has a strong acceptance rate but the most crowded submission pools on the platform, more than double the average competition of February. This matters most in piece-juried shows, where each artwork is evaluated individually against every other piece submitted.
February and October are the most underused strategic windows in the data. Fewer artists submit during these months, which means each application gets more relative attention from the juror. For artists building their submission history or working in a niche medium, these months consistently outperform what their acceptance rates alone would suggest.
April and March Have the Most Calls With Fewer Than 10 Entries
Despite its low overall acceptance rate, April has the highest proportion of calls that receive fewer than 10 total entries: 13.3% of April calls. March is close behind at 13.0%. January has the lowest proportion at 7.9%.
| Month | Calls With Fewer Than 10 Entries |
|---|---|
| January | 7.9% |
| February | 10.2% |
| March | 13.0% |
| April | 13.3% |
| May | 10.6% |
| June | 9.9% |
| July | 11.2% |
| August | 8.9% |
| September | 9.5% |
| October | 10.3% |
| November | 10.7% |
| December | 11.5% |
An under-applied call is not the same as a low-quality call. Many legitimate exhibitions simply do not market widely, are highly niche, or have eligibility criteria that limit the natural pool. When you find the right one, you may be submitting to a field of 5 to 9 artists rather than 15 to 20.
The low overall acceptance rate in April is partly driven by a subset of well-known, heavily marketed calls pulling the average down. Filtered carefully, April and March have more hidden low-competition opportunities than any other months. Finding them is the work.
On EntryThingy, you can filter calls by deadline month before applying to identify these windows. For guidance on what to look for before you commit time to an application, see our guides on how to apply to art calls and how to spot scam calls for art.
Artists Who Submit 30 Days Early Get Accepted at a 12-Point Higher Rate
Timing within a call matters as much as which month you apply. Artists who submit 30 or more days before a deadline are accepted at 71.4%. Artists who submit one day before are accepted at 59.3%.
| Submission Timing | Acceptance Rate |
|---|---|
| 30+ days early | 71.4% |
| 15-30 days early | 63.6% |
| 8-14 days early | 60.1% |
| 4-7 days early | 62.9% |
| 2-3 days early | 60.9% |
| 1 day early | 59.3% |
| Deadline day | 61.5% |
| After deadline | 65.3% |
Late entries are calls that allow submissions after the official deadline.
The 12-point gap holds consistently across the full dataset, and it lines up with something we found in our acceptance rates study: early submitters tend to be more prepared.
Their images are properly photographed and sized, their artist statement is written, and their portfolio is cohesive. That preparation shows up in the quality of the application itself.
One additional finding worth noting. Late entries, meaning submissions to calls that allow them after the deadline, come in at 65.3%. Higher than same-day submissions. This is likely because calls that permit late entries tend to be less oversubscribed overall, not because the work is stronger. Some of these artists may also be high intent submitters invited by the gallery directly.
Also, you should build 30 days of lead time into your process. One way to make that easier is to plan around your deadlines visually.
EntryThingy's calls list includes a calendar view that plots every open call by its due date, with color coding that flags how urgent each one is, red for due within 48 hours, orange for due within 7 days. You can also add any individual call straight to your own calendar from its call page.
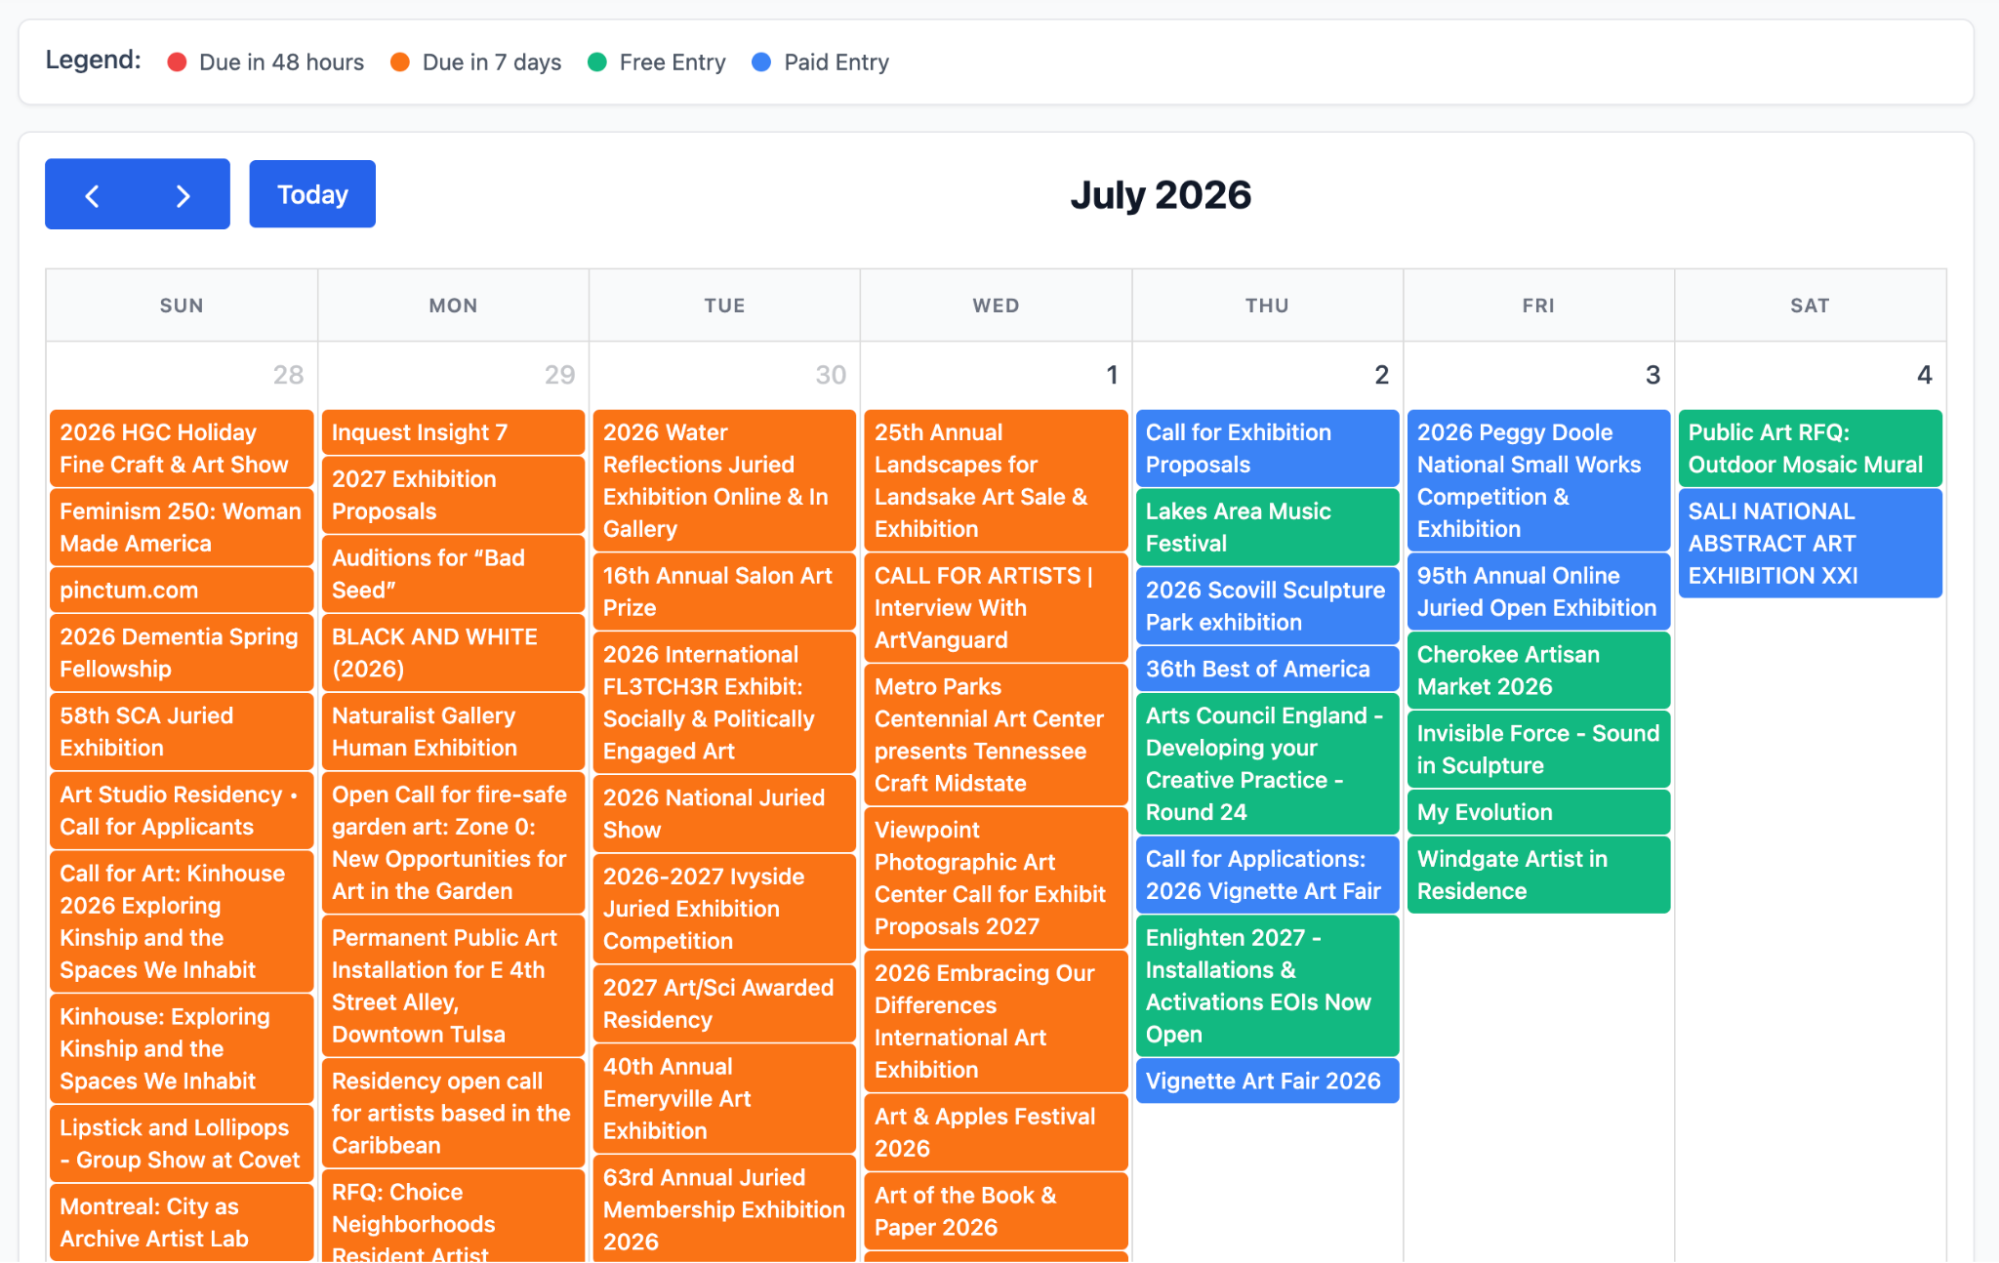
Seeing deadlines laid out this way makes it easier to spot a call early and build in the 30 days of preparation time the data points to, rather than discovering it days before it closes.
If your images are not yet submission-ready, our guide on how to photograph and resize art for submissions covers the technical requirements most calls ask for.
And our step-by-step guide on how to apply to art calls covers what to prepare before you submit.
The Full Picture: Best Months by Acceptance Rate and Competition Combined
July is the strongest month to apply. It has a high acceptance rate and only average competition, and January follows closely behind it. Looking at both signals together gives the clearest view of where the real opportunity is each month.
| Month | Acceptance Rate | Avg Entries Per Call | What It Means |
|---|---|---|---|
| July | 77.82% | 10.4 | Best overall month: high acceptance, average competition |
| January | 77.16% | 11.5 | Strong acceptance, moderate competition |
| February | 69.90% | 7.9 | Good acceptance, lowest competition on the platform |
| August | 76.38% | 17.1 | High acceptance but highest competition: be selective |
| October | 60.02% | 8.3 | Average acceptance, very low competition |
| April | 53.22% | 9.0 | Lowest acceptance, no competition advantage |
| November | 53.68% | 11.9 | Lowest acceptance, moderate competition |
February is the most strategic underdog month. The acceptance rate is not the highest in the dataset, but you are submitting to the least crowded pool on the platform. For artists whose work fits a specific niche or who are building their submission history, February regularly punches above its headline rate.
August is a split signal: strong acceptance rate, but the highest competition on the platform. It rewards selective applications to calls that genuinely fit your work. Volume applications in August are the worst use of the month.
April and November offer no advantage on either measure. Low acceptance rates, no reduction in competition. The only reason to apply heavily in these months is if you find under-applied calls that match your practice precisely.
What to Do With This Data
A genuinely strong fit for your work is worth applying to in any month. What this data gives you is a way to prioritize your time and decide where to be more selective.
Prioritize July and January when you can. Both months combine the highest acceptance rates with manageable competition. If your work is ready, lead with these months.
Use February and October for strategic submissions. The least competitive pools on the platform. Particularly strong for artists whose work fits a niche that is not overrepresented in general calls.
Be more selective in April and November. Acceptance rates run 24 points below the peak months, so this is where fit matters more than volume.
Build 30 days of lead time into every application. The gap between a prepared early submission and a rushed last-minute one is 12 points. Preparation drives that difference, not the date itself.
Look for under-applied calls in April and March. Despite lower overall rates, these months have the highest proportion of calls with fewer than 10 entries. One well-targeted low-competition application outperforms several rushed ones to oversubscribed shows.
Submit midweek when you have the choice. Wednesday and Thursday submissions are accepted at 65 to 67%, compared to 62% on Fridays and weekends. A modest gap, but consistent across the data.
The easiest way to put this into practice is to filter for what matters to you directly. On EntryThingy, you can filter the calls list by state, city, medium, and deadline, and toggle options like free-only or EntryThingy-only listings.
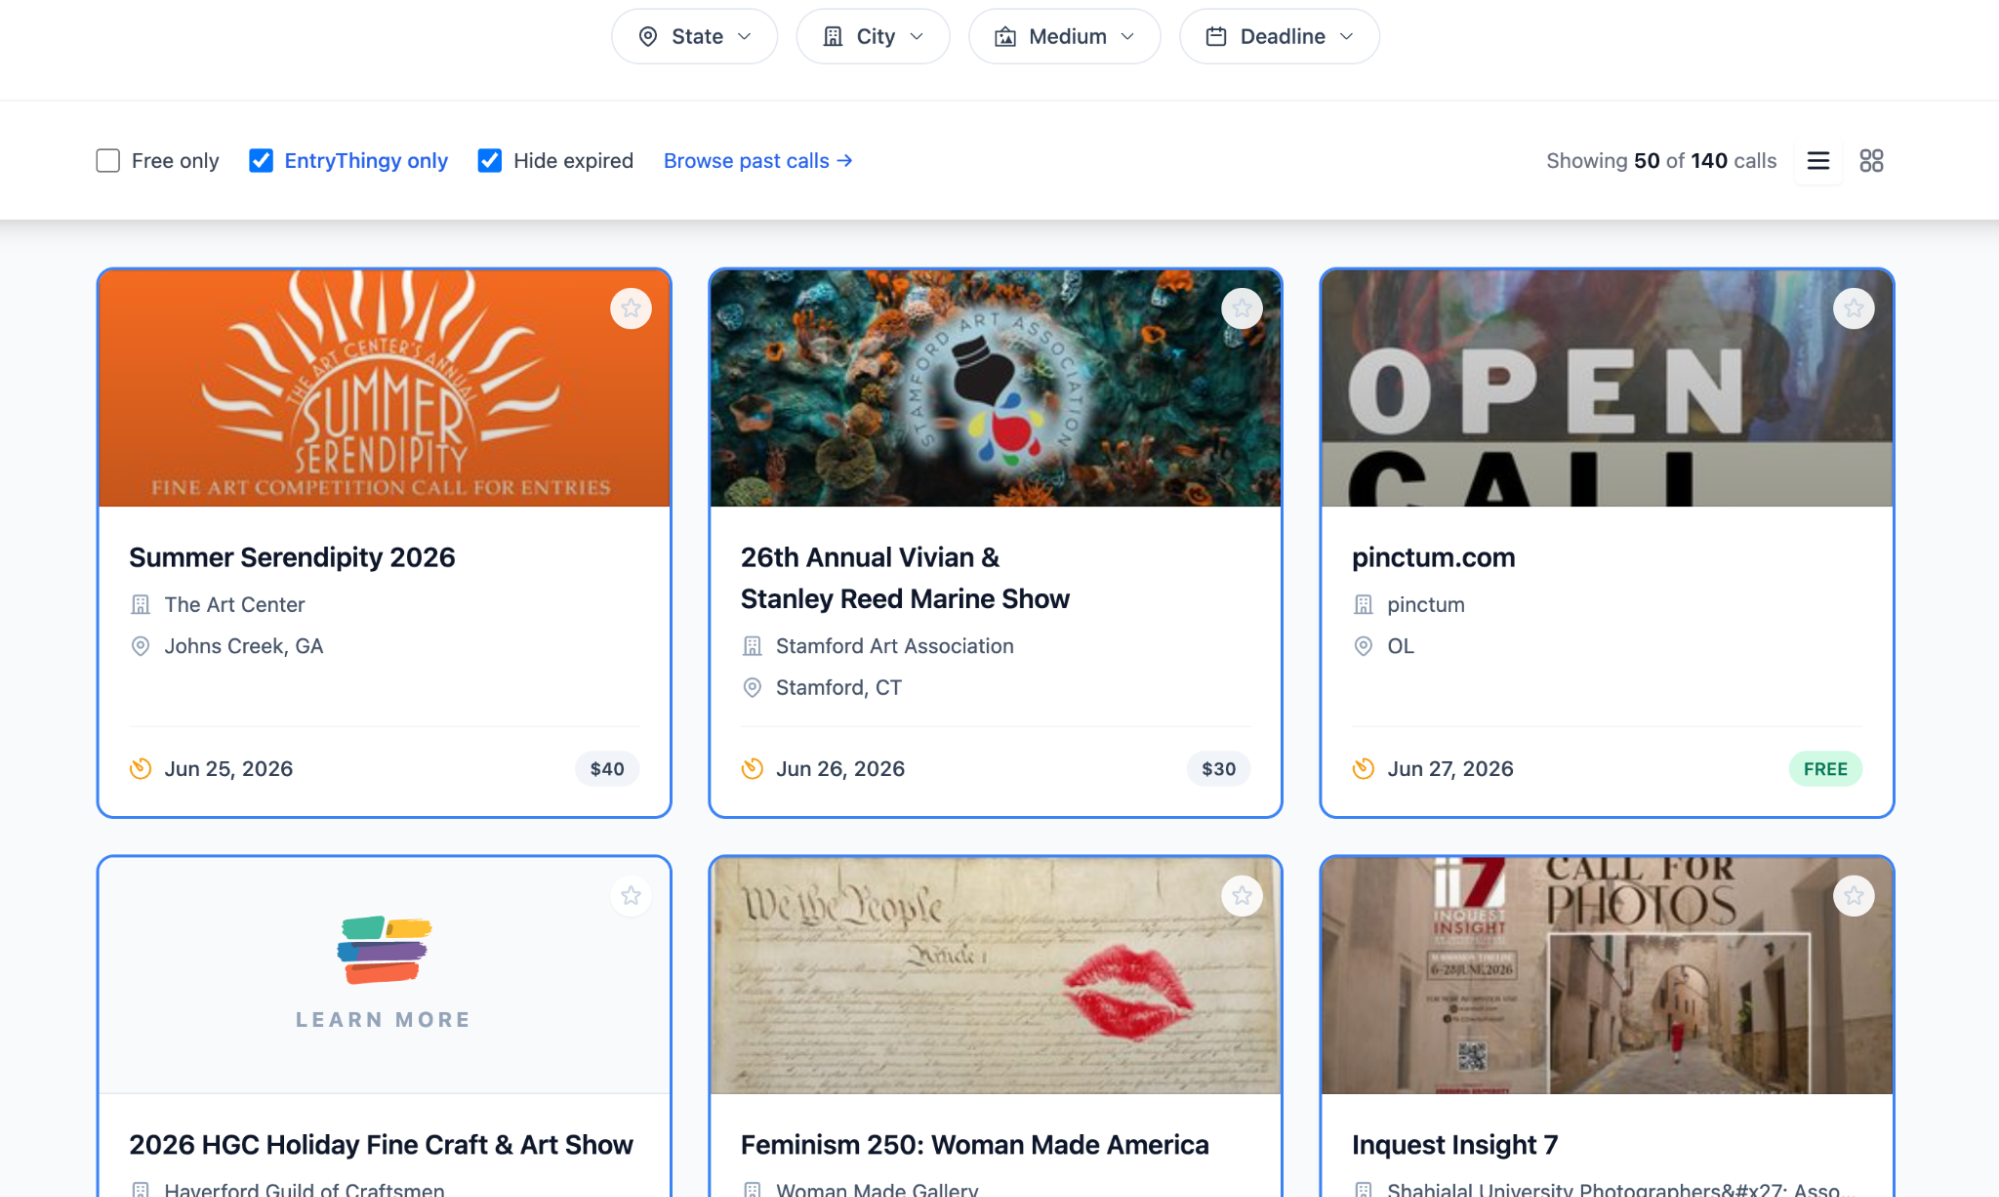
Ready to put this into practice? Browse open art calls on EntryThingy and filter by deadline, medium, and location to find what's open right now.
Browse Open Art CallsCommon Questions About Art Call Timing
What is the best month to apply to art calls?
July has the highest acceptance rate in the dataset at 77.82%, with only average competition. January (77.16%) follows closely. February offers the least competitive pool on the platform with a strong 69.9% acceptance rate, making it the best month for targeted submissions in less crowded categories.
What is the worst month to apply to art calls?
April (53.22%) and November (53.68%) have the lowest acceptance rates in the dataset. Both months attract high submission volumes relative to available spots, which drives rates down by as much as 24 points compared to the peak months.
Does submitting early actually improve your chances?
Yes. Artists who submit 30 or more days before a deadline are accepted at 71.4%, compared to 59.3% for those who submit one day before. The 12-point gap is consistent across the full dataset. Preparation time drives the difference, not the submission date itself.
Are there art calls with very low competition?
Yes. Between 10 and 13% of calls receive fewer than 10 total entries each month. April and March have the highest proportion of these under-applied calls at 13.3% and 13.0%. Filtering by deadline month on EntryThingy can help identify them before you apply.
How many art calls are posted each month?
January sees the most new calls posted (265 on EntryThingy), followed by March (254) and October (242). September is the quietest month at 193 new postings. Most calls are posted 53 to 76 days before their deadline.
Does the day of the week affect acceptance rates?
Slightly. Wednesday submissions accept at 67.2%, compared to 62.3% on Fridays. The gap is consistent but modest. Preparation matters far more than which day you submit.